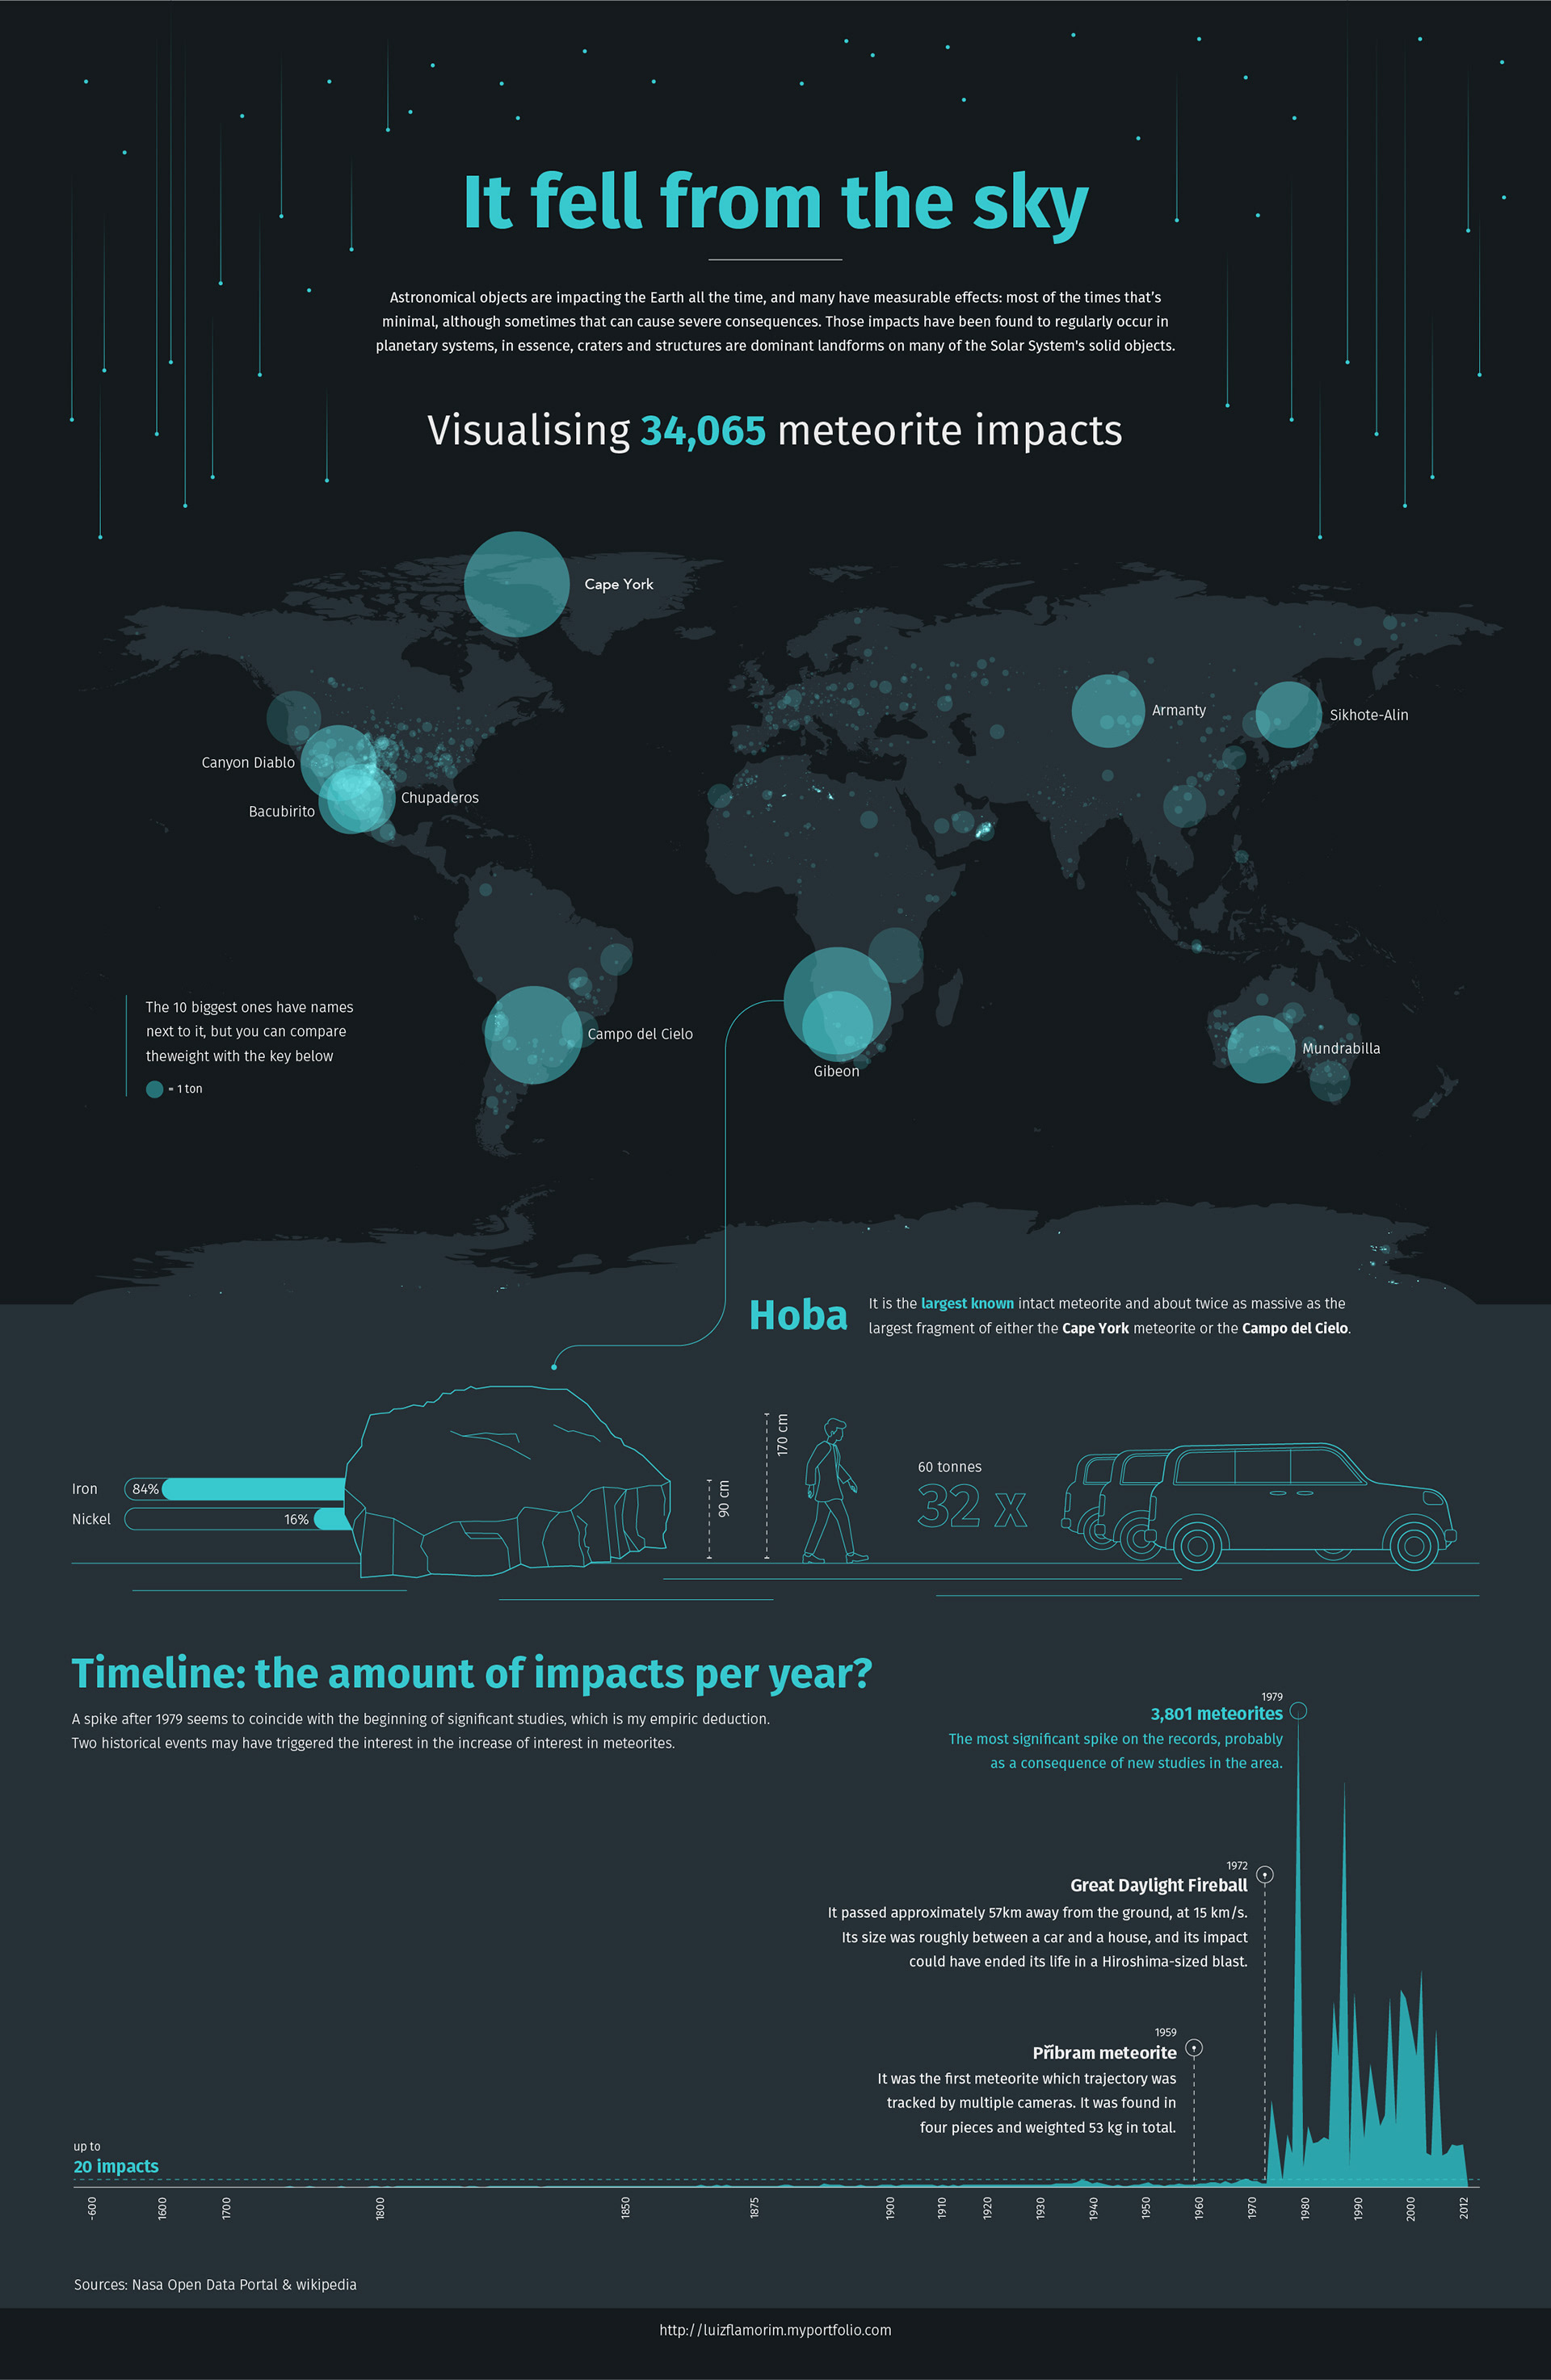
Visualising 34,000 meteorites impacts!
My interest in this this subject came from a recent article I read in which Stephen Hawking said:
"One of the major threats to intelligent life in our universe is a high probability of an asteroid colliding with inhabited planets."
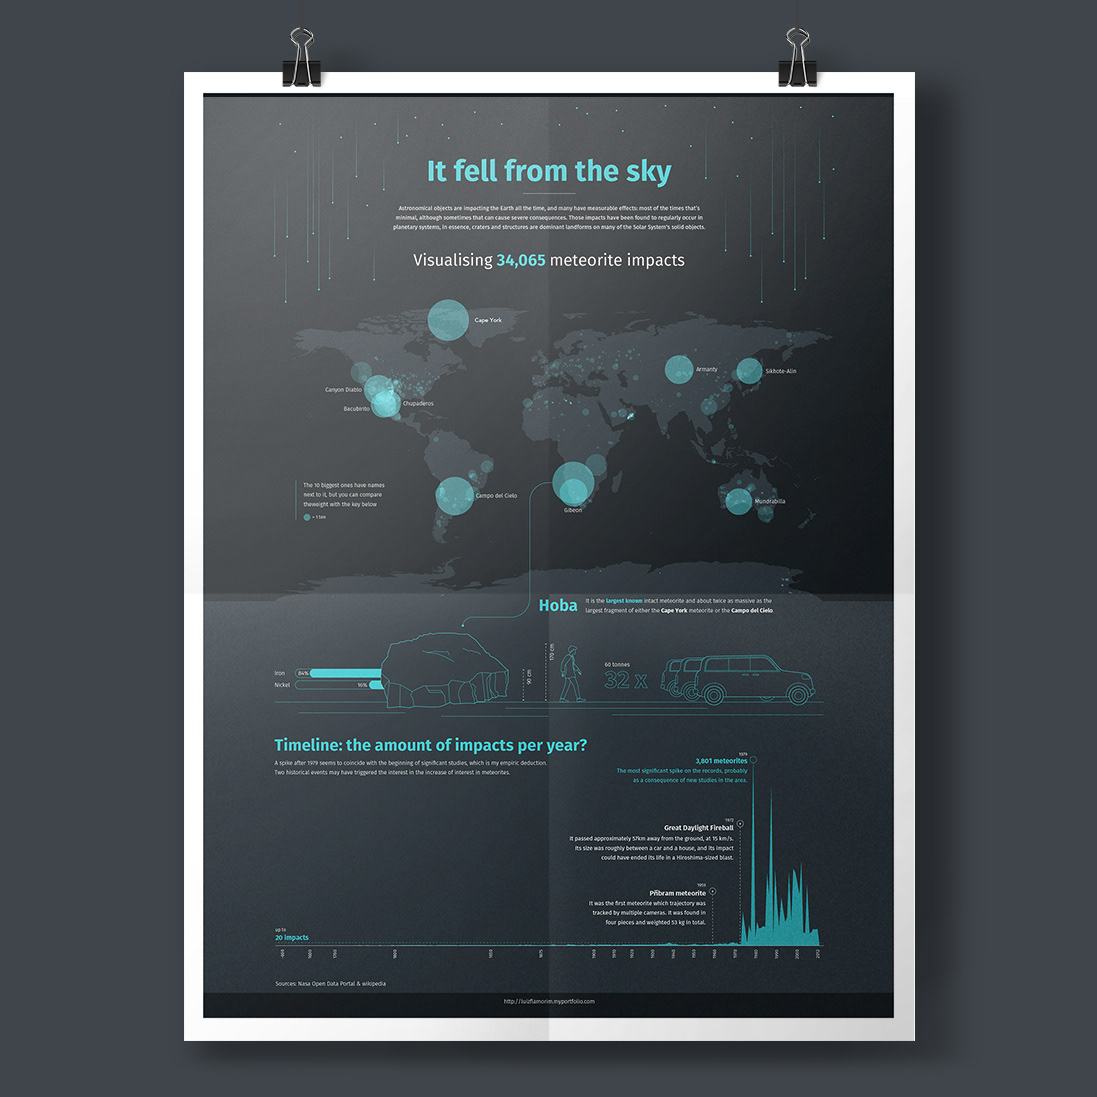
The dataset I used is available through this link, and it is in constant update. My goal was to produce a visual appealing poster about this frightening and curious story.
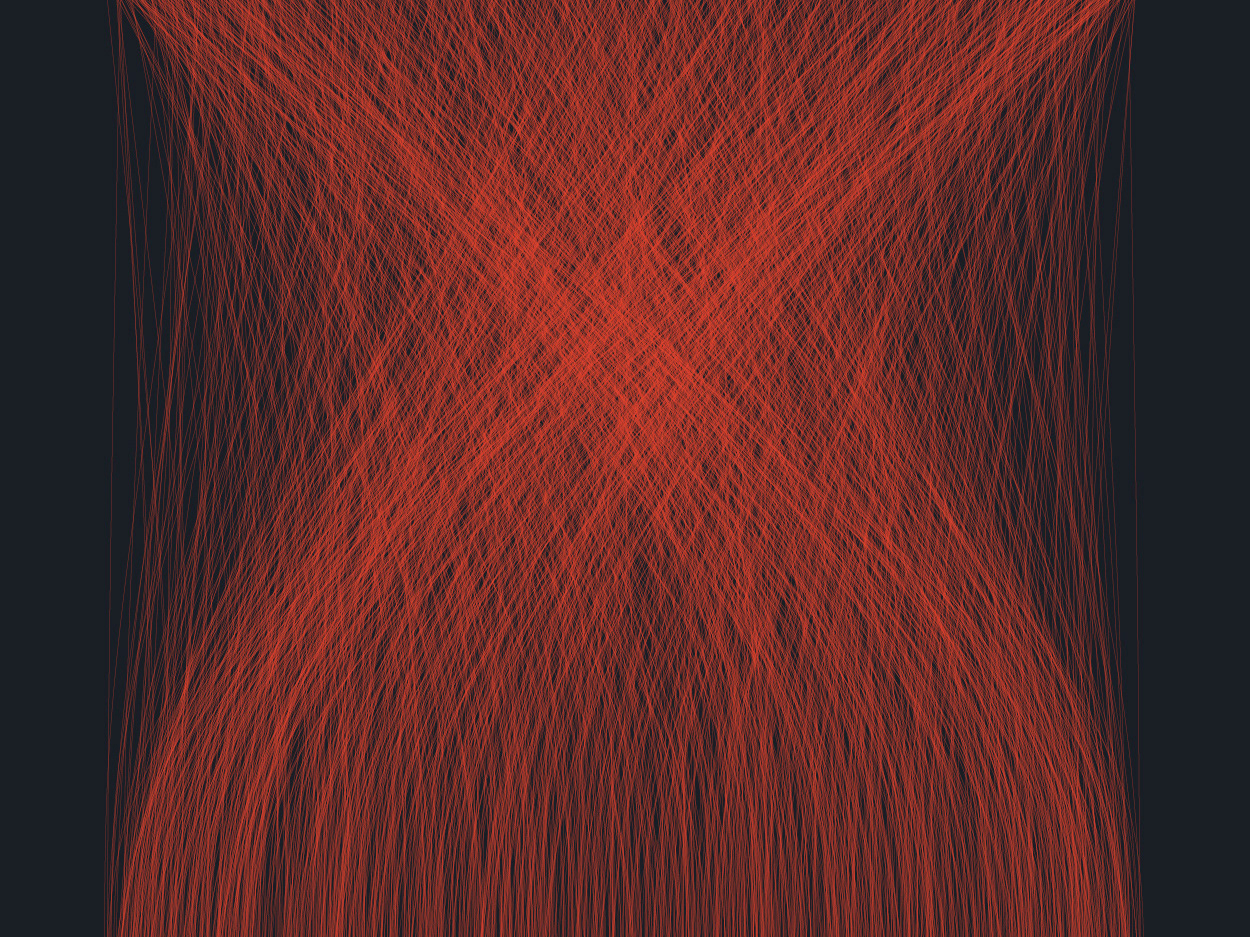
I manage to do several simple visualizations to test the dataset, but what struck me more was the fact that many of the recorded strikes are located in recent years. That can raise many questions which can make the overall story a bit more interesting: is the world as we know ending? What was the trigger that caused this spike on the records? What about the future?

This is partially the dataset I used, including the categories: name, year, mass, latitude and longitude.
I couldn't find the most accurate answer; however my research led me to two events that might have increased the data records.
The story was not so dramatic, so I decided to explore it in stages: plot 34 thousand records in a map through coding, compare the size of the biggest meteorite, and finally show the timeline of the records.
The story was not so dramatic, so I decided to explore it in stages: plot 34 thousand records in a map through coding, compare the size of the biggest meteorite, and finally show the timeline of the records.
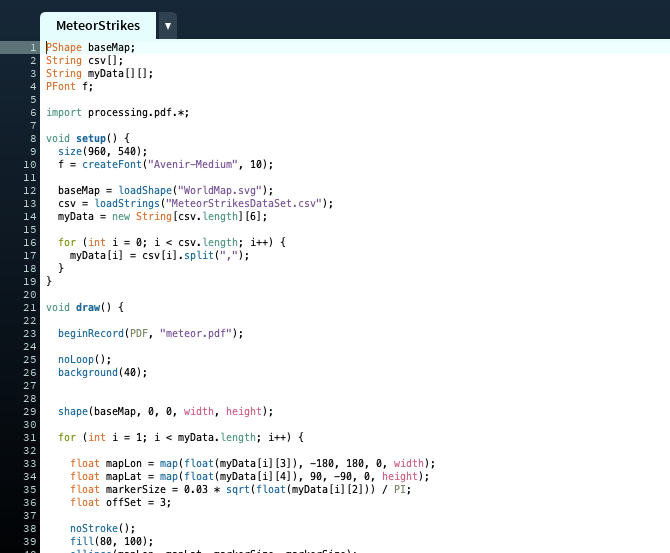
This is the code I used to plot the 34,000 impacts in the map.
For making it, I treated the data in Excel, used Java on processing to plot the strikes in a map and made the adjustments in Adobe Illustrator.