Interactive visualisation using Netflix data

Imagine a visual journey through the world of your entertainment. What if you could take your viewing history and turn it into an artful masterpiece, revealing the story behind your choices? That's precisely what I set out to do with my latest project: creative coding to build visualisations.
I started by delving into my own Netflix viewing data, discovering a treasure trove of insights waiting to be unearthed. My goal was clear: create an app that not only visualised the titles I'd watched but also added a whole new layer of information by connecting to the TMDB for real-time updates.
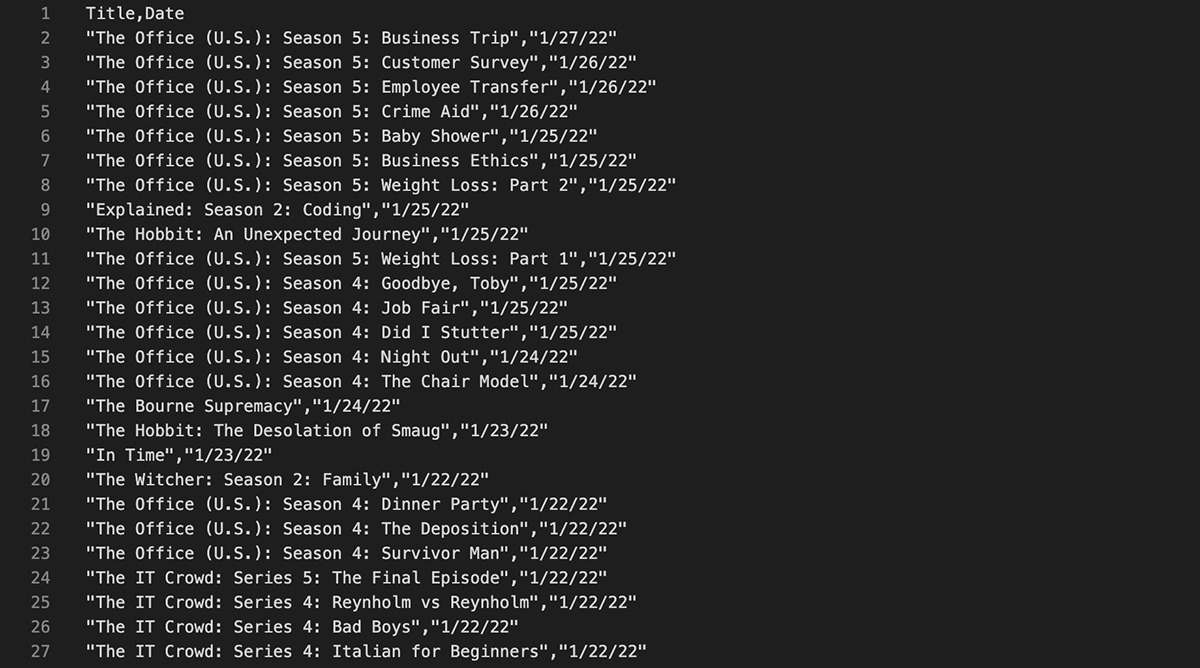
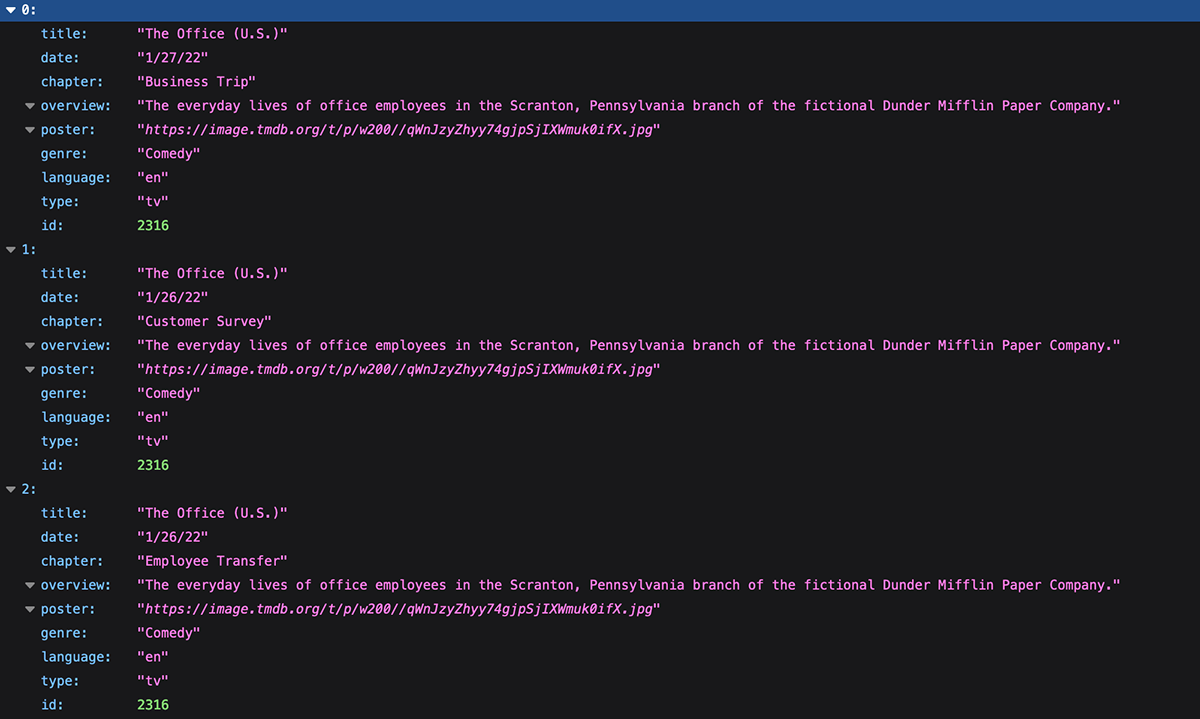
To make this vision a reality, I turned to Node to normalise my data and make it searchable. The secret sauce was the integration of the TMDB API, which boosted its potential. Now, when a user clicks on a title, the app springs to life, delivering a wealth of dynamic information. Check the difference in between the original dataset below, and how best it was organised.
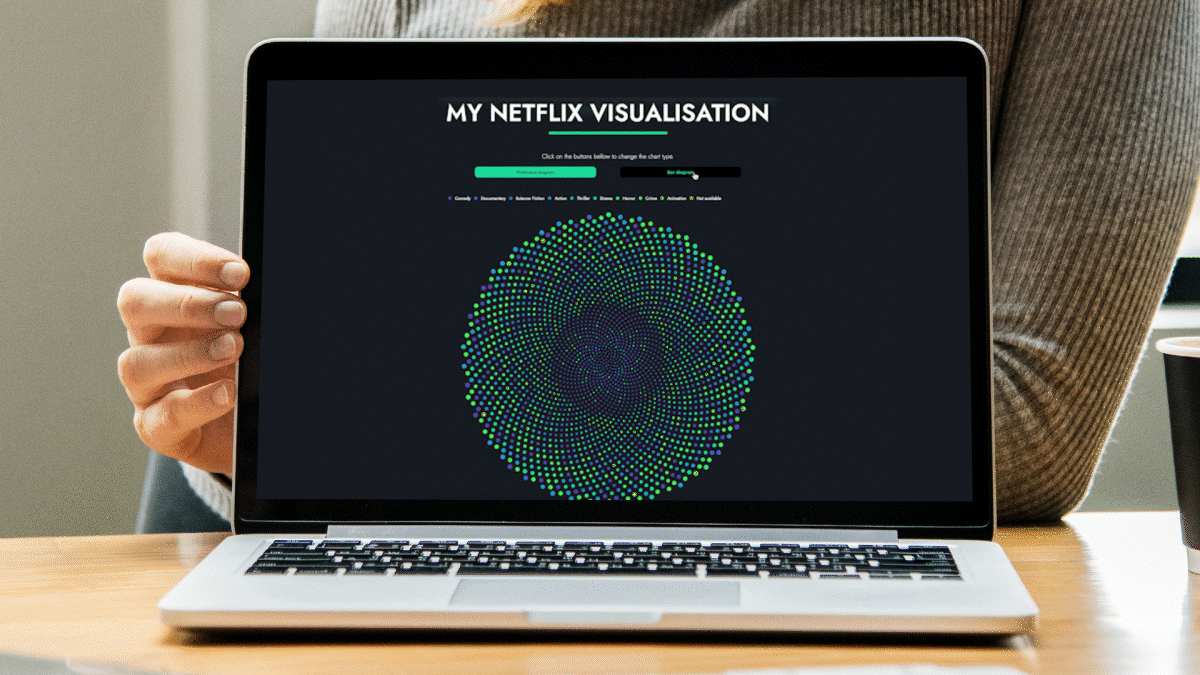
But this project was more than just data. It was about art and geometry. I revisited Geometry classes to create a captivating sunflower-like spiral to arrange the films. The result? A visualisation that captivates the viewer, allowing them to toggle between two distinct data states at the touch of a button.
Discovering Insights in the Data Maze
While on my journey, I stumbled upon a fascinating revelation. The dataset showed an intriguing spike during the pandemic, which at first seemed like a significant change in my viewing habits. However, here's the twist – the spike wasn't just a reflection of my behaviour. It was a testament to the limitations of the dataset itself. Netflix, it turns out, only offers the most recent viewing date, leaving the history uncharted.
Key Takeaways: This project has taught me that data isn't just numbers; it's a canvas for storytelling. Even with incomplete information, the power of data visualisation and the possibilities of API integration are boundless.
If you're as fascinated by this journey as I am, I invite you to explore the project, which I developed in just a couple of weeks. The code is open on GitHub, waiting for the next wave of creativity to bring it to life.